Written by Michael Hyman, July 8, 2022
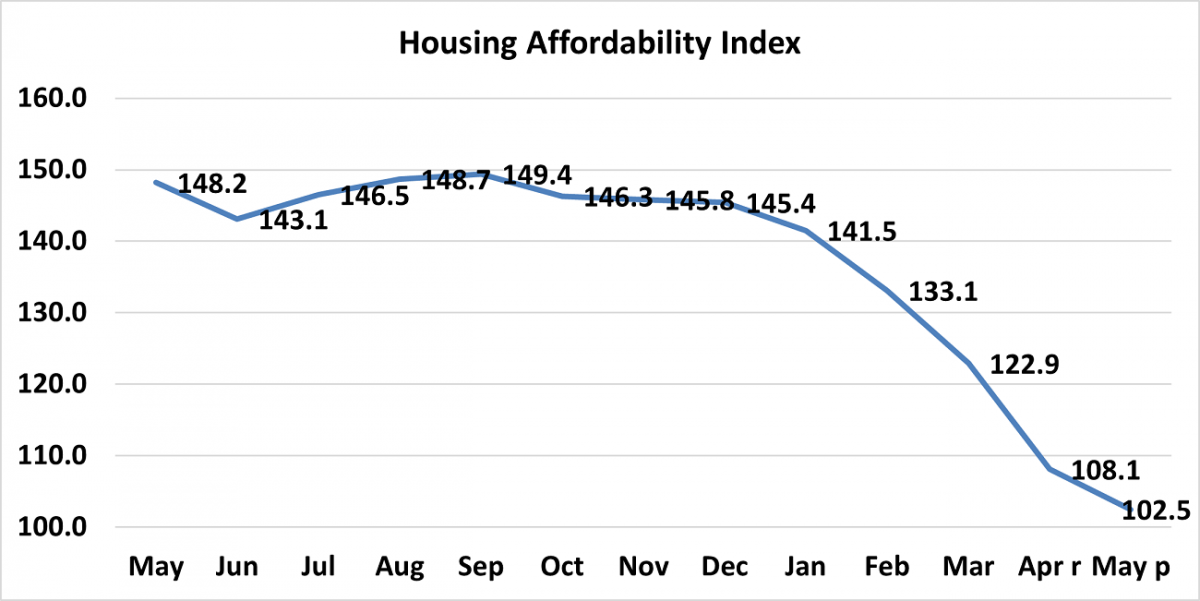
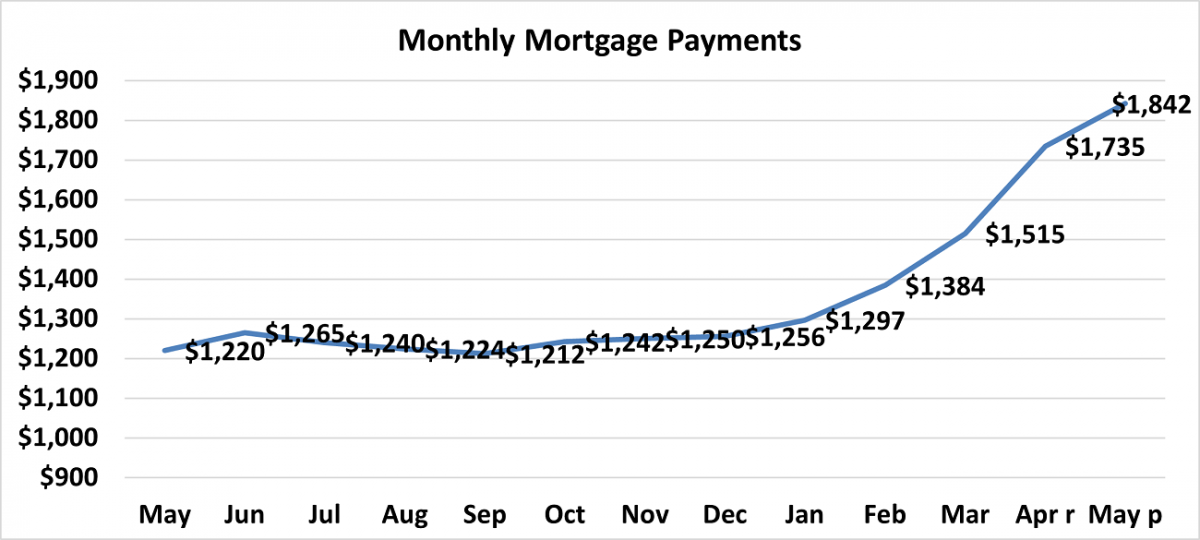
At the national level, housing affordability weakened in May compared to the previous month according to NAR’s Housing Affordability Index. Compared to the prior month, the monthly mortgage payment increased by 6.2% while the median family income increased modestly by 0.7%.
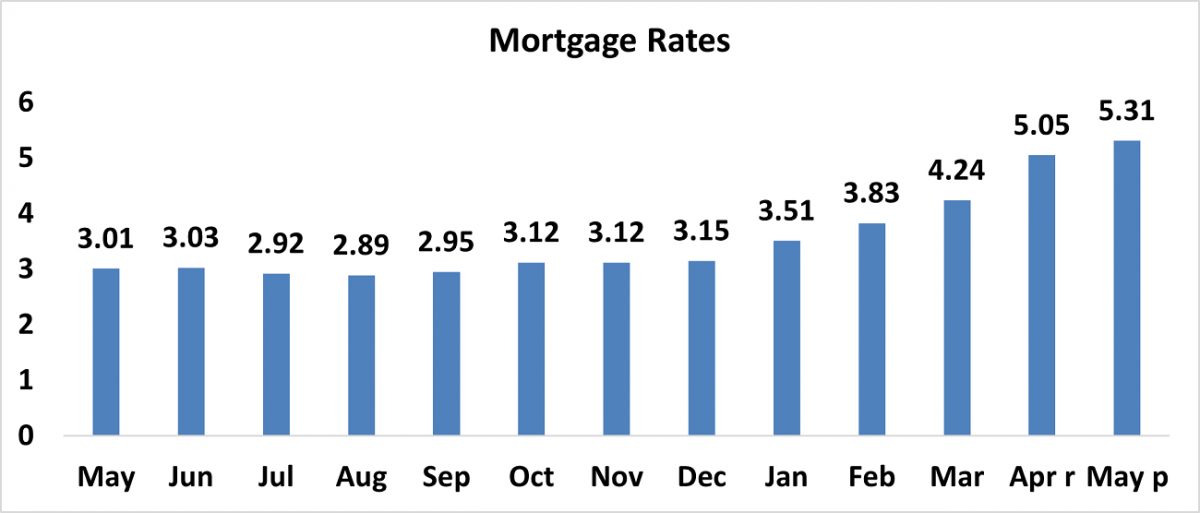
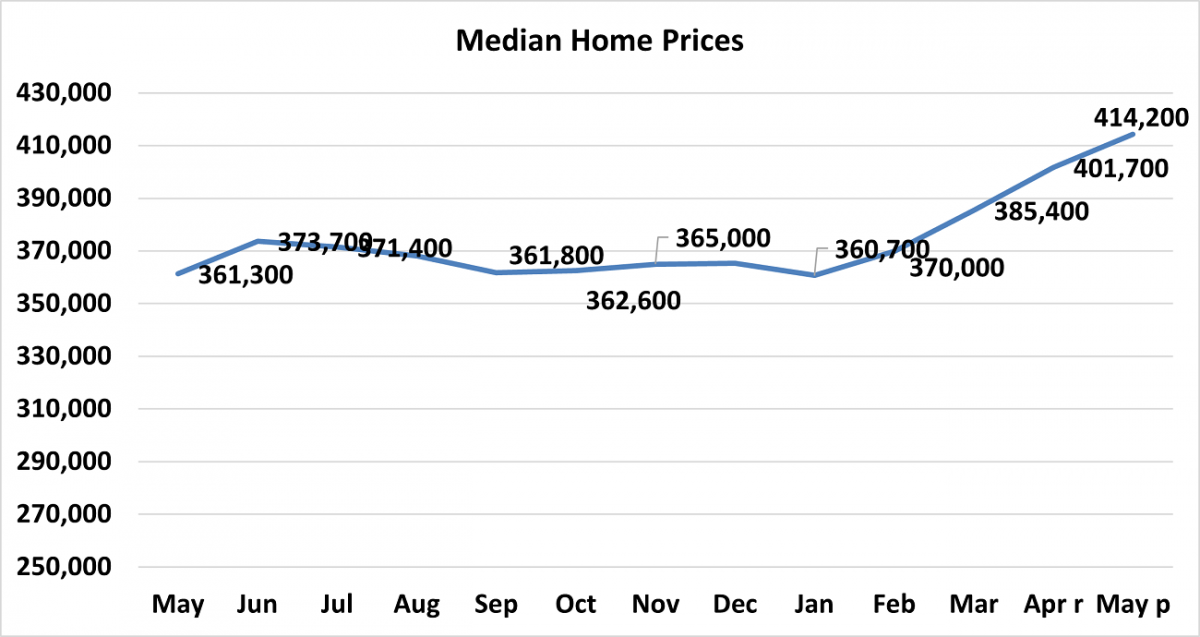
Compared to one year ago, affordability fell in May as the monthly mortgage payment climbed 51% and median family income rose by 4.5%. The effective 30-year fixed mortgage rate1 was 5.31% this May compared to 3.01% one year ago, and the median existing-home sales price rose 14.6% from one year ago.
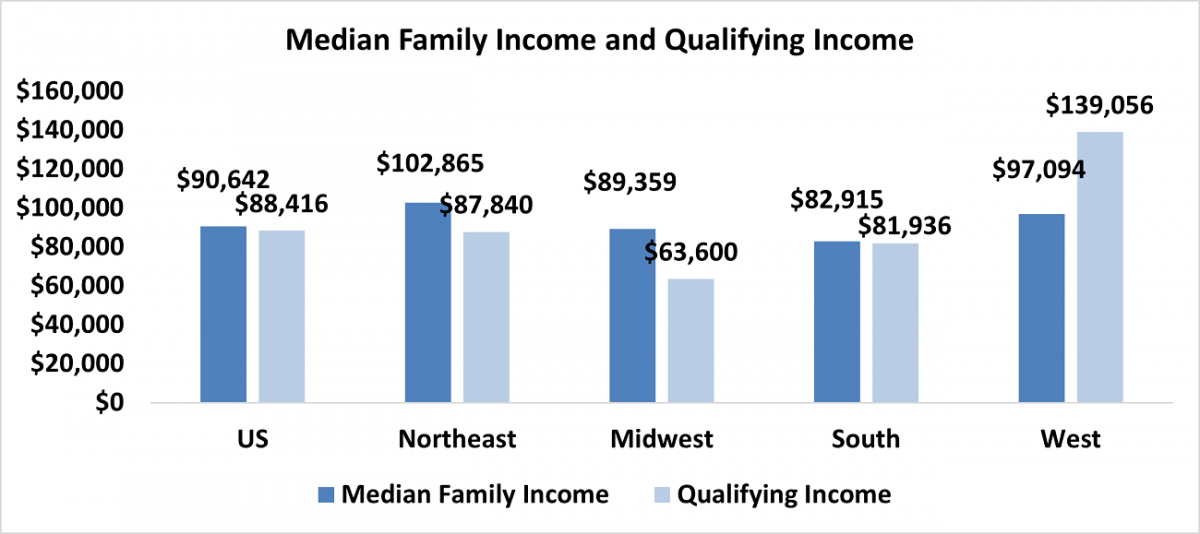
As of May 2022, the national and regional indices were all above 100, except in the West where the index was 69.8. An index above 100 means that a family with the median income had more than the income required to afford a median-priced home. The income required to afford a mortgage, or the qualifying income, is the income needed so that mortgage payments on a 30-year fixed mortgage loan with a 20% down payment account for 25% of family income.2 The most affordable region was the Midwest, with an index value of 140.5 (median family income of $89,359 with a qualifying income of $63,600). The least affordable region remained the West, where the index was 69.8 (median family income of $97,094 and the qualifying income of $139,056). This would be the third consecutive month that the West index was below 100. The South was the second most affordable region with an index of 101.2 (median family income of $82,915 and the qualifying income of $81,936). The Northeast was the second most unaffordable region with an index of 117.1 (median family income of $102,865 with a qualifying income of $87,840).
A home purchase was unaffordable for a typical first-time buyer intending to purchase a typical home. First-time buyers typically spent 25.6% of their family income on mortgage payments, making a home purchase unaffordable. A mortgage is affordable if the mortgage payment (principal and interest) amounts to 25% or less of the family’s income.1
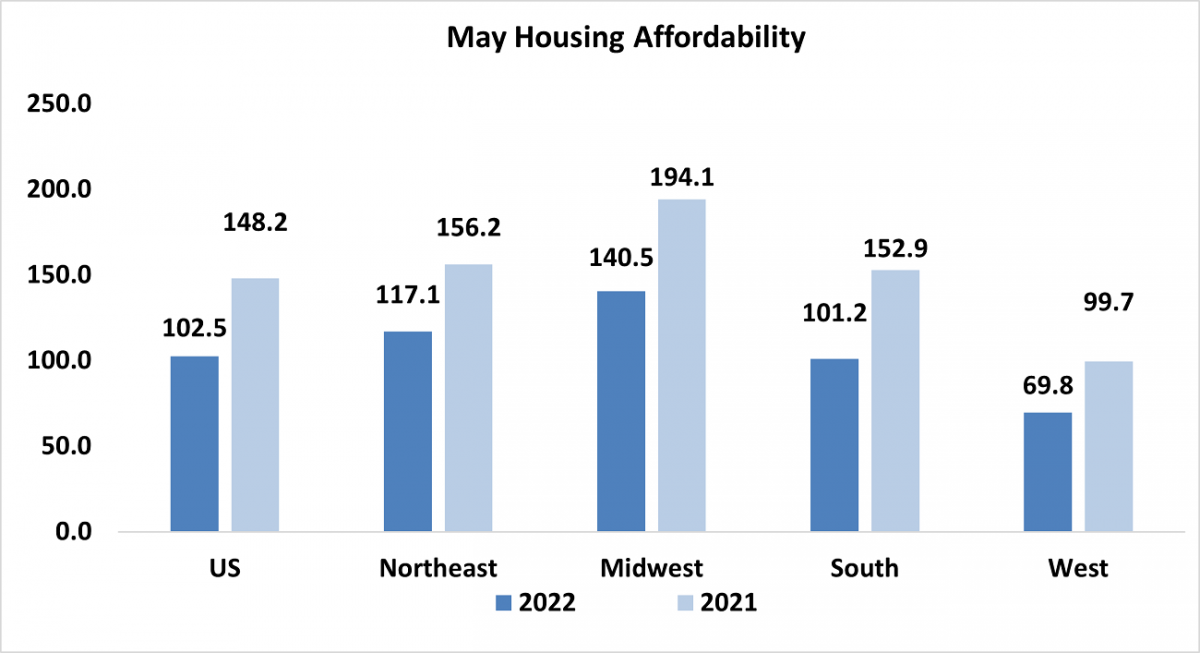
Housing affordability3 had double-digit declines from a year ago in all four regions. The South had the biggest decline of 33.8%. The West experienced a weakening in price growth of 30% followed by the Midwest at 27.6%. The Northeast had the smallest dip of 25%.
Affordability was down in all regions from last month. The Midwest region fell 6.5% followed by the South with a decline of 6.2%. The West was down 3.5% followed by the Northeast which had the smallest decrease of 0.4%.
Nationally, mortgage rates were up 230 basis points from one year ago (one percentage point equals 100 basis points) from 3.01 to 5.31%.
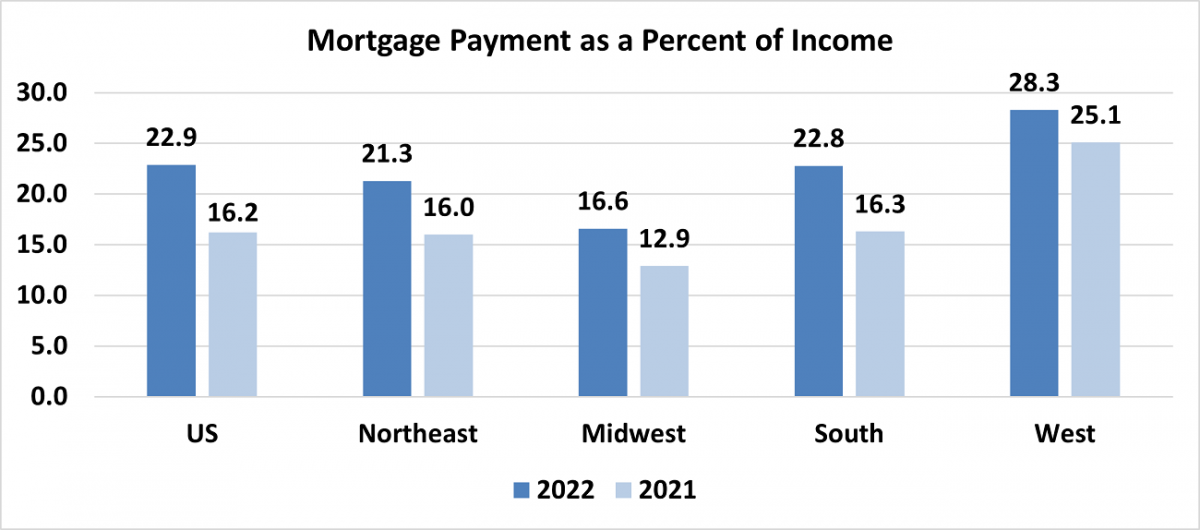
Compared to one year ago, the monthly mortgage payment rose to $1,842 from $1,220, an increase of 51%, The annual mortgage payment as a percentage of income inclined to 24.4% this May from 16.9% a year ago. Largely due to higher home prices compared to modest gains in median family incomes and higher mortgage rates. Regionally, the West has the highest mortgage payment to income share at 35.8% of income. The South had the second highest share at 24.7% followed by the Northeast with their share at 21.3%. The Midwest had the lowest mortgage payment as a percentage of income at 17.8%. Mortgage payments are not burdensome if they are no more than 25% of income.4
This week, the Mortgage Bankers Association reported that mortgage applications declined 5.4% from a week earlier. Mortgage rates are having a significant impact on monthly mortgage payments. Home prices in some states continue to rise, putting even more pressure on affordability conditions. Potential home buyers may still see some challenges ahead if mortgage rates continue to rise and family incomes don’t keep pace with home prices. Additional inventory, new or existing, is always a good sign for new home buyers. With higher rates, homeowners are still finding home ownership a means of building long-term wealth.
Find the data release.
The Housing Affordability Index calculation assumes a 20 percent down payment and a 25 percent qualifying ratio (principal and interest payment to income). See further details on the methodology and assumptions behind the calculation.
1 Housing costs are burdensome if they take up more than 30% of income. The 25% share of mortgage payment to income takes into account that homeowners have additional expenses such as mortgage insurance, home insurance, taxes, and expenses for property maintenance.
2 A Home Affordability Index (HAI) value of 100 means that a family with the median income has exactly enough income to qualify for a mortgage on a median-priced home. An index of 120 signifies that a family earning the median income has 20 percent more than the level of income needed to pay the mortgage on a median-priced home, assuming a 20 percent down payment so that the monthly payment and interest will not exceed 25 percent of this level of income (qualifying income).
3 Total housing costs that include the mortgage payment, property taxes, maintenance, insurance, and utilities are not considered burdensome if they account for no more than 30% of income.
4 The Mortgage Bankers Association (MBA) analyzes data from Ellie Mae’s AllRegs® Market Clarity® business information tool. A decline in the MCAI indicates that lending standards are tightening, while increases in the index are indicative of loosening credit.

Michael Hyman
Research Data SpecialistMichael Hyman is a Research Data Specialist for the National Association of REALTORS®.